Predicting Failure: Break production often to improve reliability.
We discuss how to measure production failures and correlate them back to your delivery practice. By doing so you can forecast when failures are most likely to happen and in what parts of your system.
Picture the classic scenario:
Customers are calling into your business to inform your of broken features, or worse that your website doesn't load at all. You inform your CTO or engineers and scramble to debug what's going on. You're not even sure if it's a repeatable issue. Eventually you determine there is a real bug, put together a hot-fix, and cut a release.
For many companies that's where the process ends. There are strategic frameworks related to triaging and incident response, but we are focusing on analyzing our failures. In order to learn from our failures we need to collect a lot of data. Often times a bug ticket or sparse artifacts are all that exist. In order to build an insightful dataset we need to track and measure more production failures. Once we have a statistically significant dataset we can gain highly effective insights that will increase your site reliability and uptime.
Collecting Failure Data
In general there are two types of failure scenarios: operating failures and design failures. An operating failure is when the software system fails due to load, bottlenecks, or other internal factors. Typically this happens when a site receives more traffic than it can handle or a database grows too big. A design failure is where a change to the software system causes a failure due to an incorrect implementation or bad design. In order to catch these failures we must look at two different parts of the software lifecycle: 1) Deployments and 2) Production Monitoring and Maintenance. We will describe how each of these failures release to these parts of the lifecycle.
Software Design Failures & Deployments
Software design failures are typically caught in late-stage testing like a staging environment, canary release, or during production smoke tests. If it's caught; great news, but sometimes it's missed. In those cases your customers start to call or your monitoring starts to throw alarms.
To ensure we are capturing our failures around production releases we should track the following. Even if you store this information in a spreadsheet you can use this data as great starting point. Each row should be comprised of:
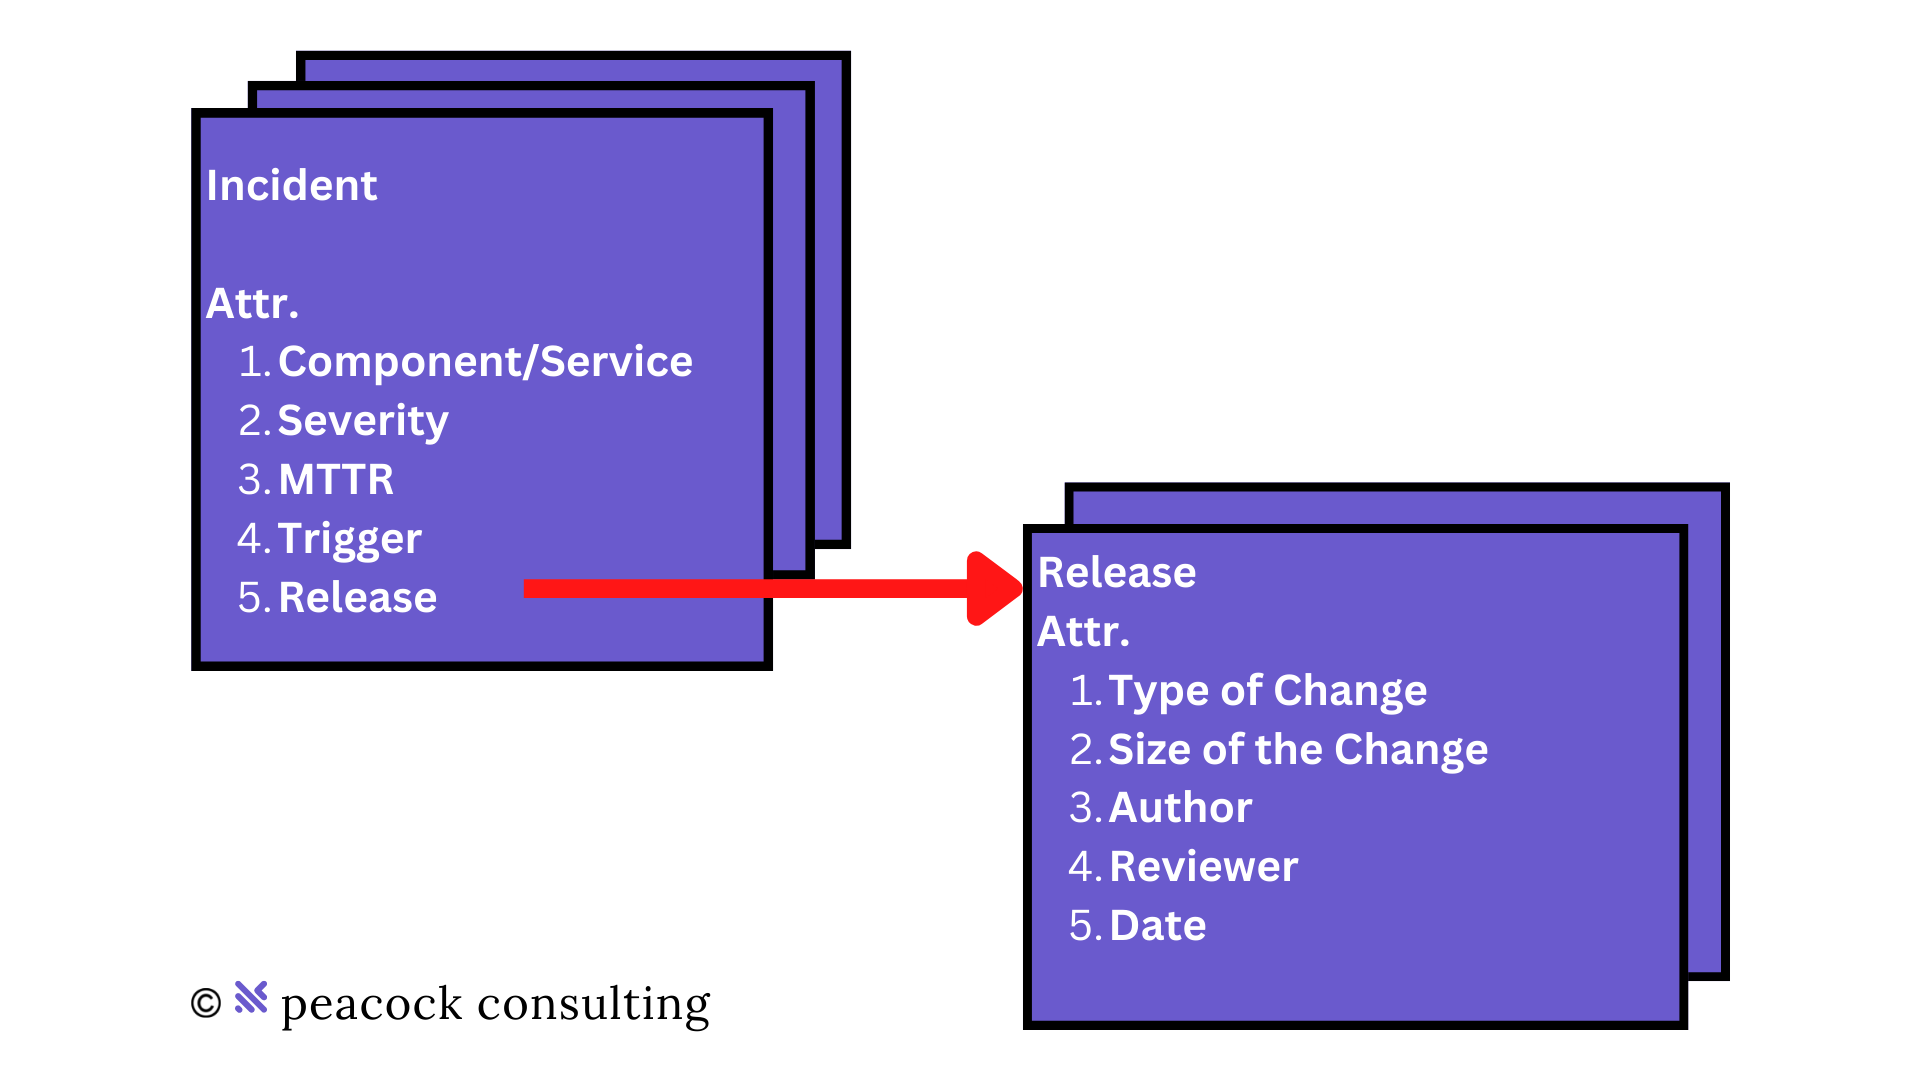
- Type of Change: New Work, Re-Work, or Other/Maintenance
- Size of the Change: Diff of lines of code
- Severity: Scale of 1-5 (1 is worst)
- MTTR: Time from error start to fix deployed
- Date of Change: 12/1/2022
Operating Design Failures & Production Monitoring
Operating failures on the other hand are found in post-release and maintenance of your production software systems. In this scenario the data you collect is similar but needs to include informatino about the system that failed.
- Component/Service: Service name
- Severity: Scale of 1-5 (1 is worst)
- MTTR: Time from error start to fix deployed
- Trigger: User A made a request when XX users were online
In fact, you can combine the two sets of data to capture both failure cases in a single dataset. By creating a separate "Release" data model you can reference operating failures or "Incident" back to their corresponding production deployment or "Release".
Building Statistical Signifigance
In order to gain effective insights we need a statically significant data set. If we borrow from Lean Six Sigma best practices, we need at least 20 data points on "Incidents" and "Releases". In a high throughput software team or organization you could consider the following:
In a month we will have plenty of data on releases, but let's assume only 10% of those releases cause a small failure (which would make you an excellent team). That would mean:
Therefore, we will need a month of data at this delivery rate to generate 20 Incidents. If your team doesn't deliver at this rate and you'd like to please email us! getstarted@peacockconsulting.com
Now, with data in hand you can begin to analyze and classify your failures. A sample dashboard is shown below, of course this can be implemented in your favorite dash-boarding tool. Some metrics that are a good starting point include: Incident by Severity histogram, MTTR by Quarter, Incidents by Type of Work, and Average size of Code Change per Incident.
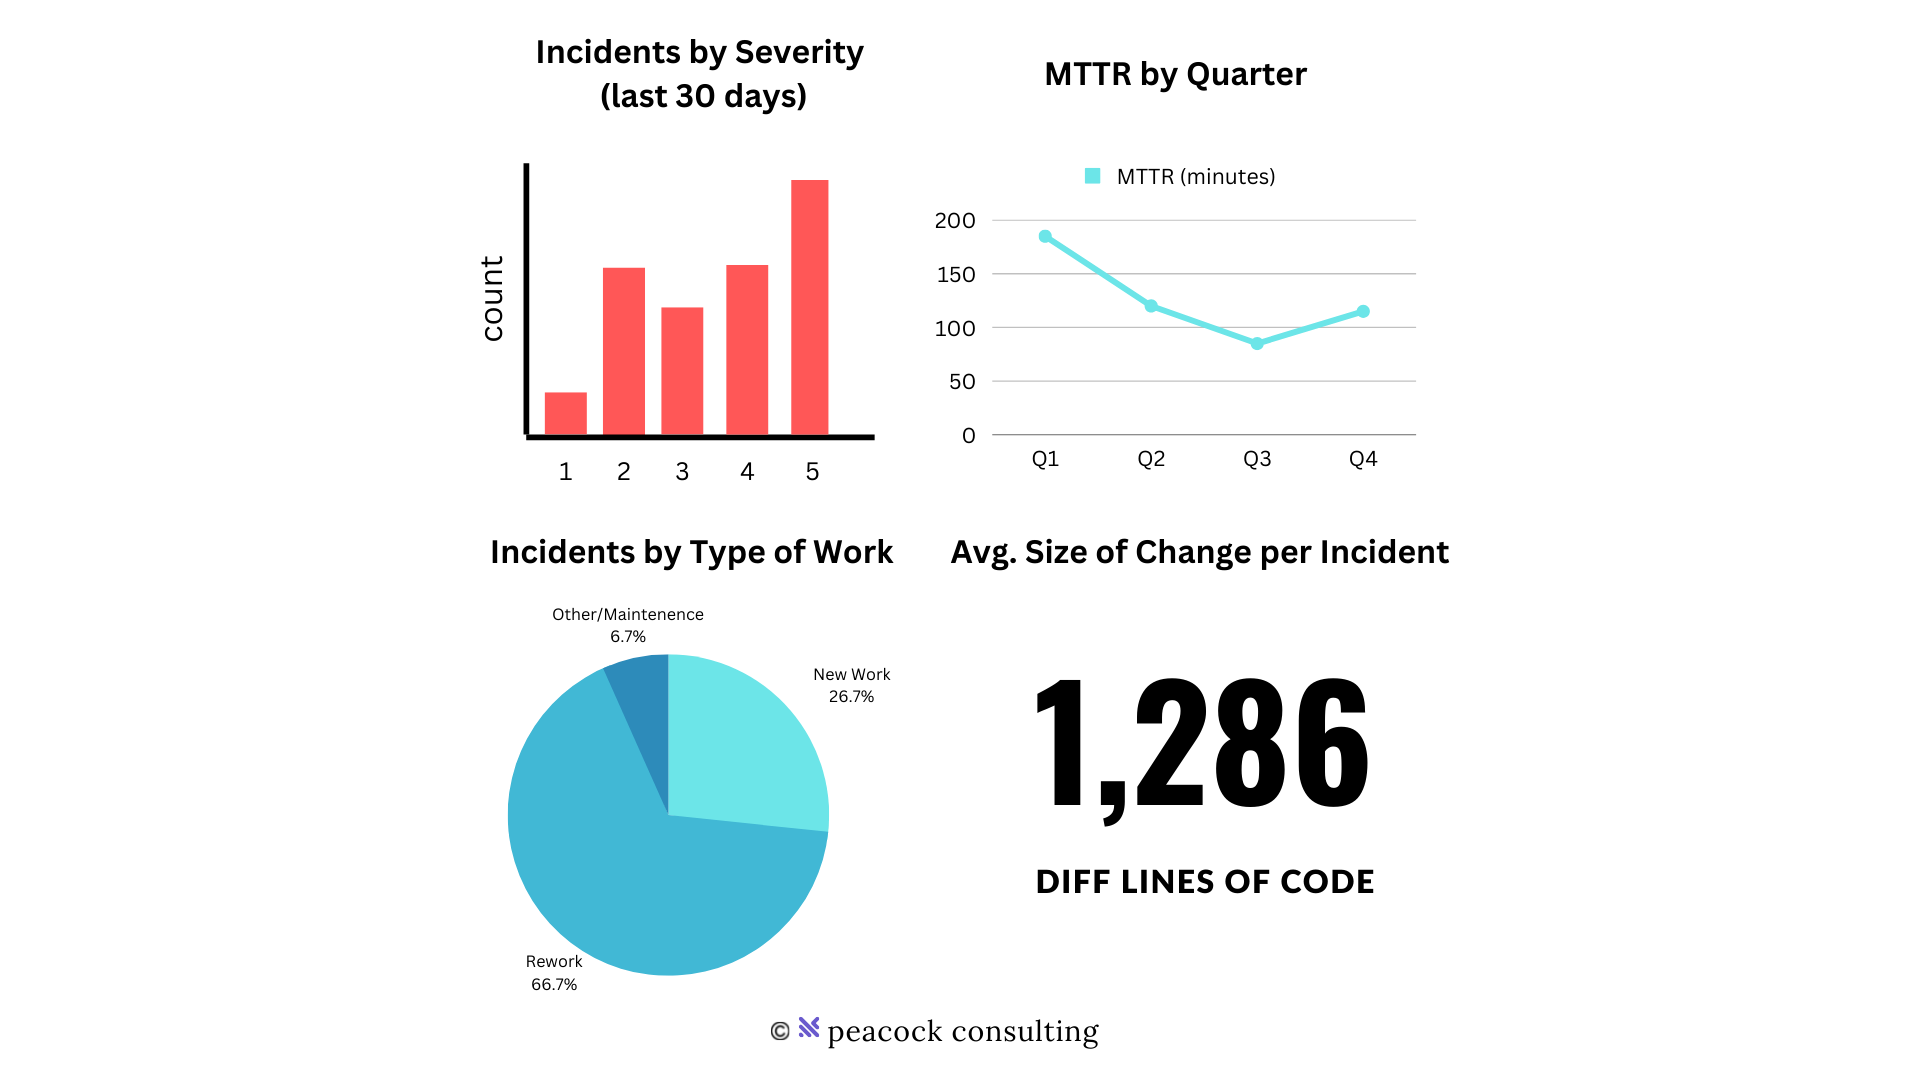
Next, effective insights and trends will be found in the data. Some may be obvious, and yet many organizations don't know where to start or how to justify their investments:
- Smaller code change have a lower probability of causing an incident.
- Some parts of your system are more prone to failure due to complexity.
- Types of work like rewriting tech-debt can be measured through risk/reward.
This "Incident" and "Release" data will become the basis of changes or systems that have a high likelihood of failure. Once you have identified the sources you can develop a strategy to improve. Often times these strategies fall into the following categories:
- SDLC - Shifting left of quality, security, and more.
- Production Monitoring - Decrease your mean time to detection.
- Scoping smaller changes - Decreasing cycle-time, increasing release frequency.
- Release Process - Tracking failed releases, and automatically rolling back
- Tech-debt - Reducing blast radius through distributed architectures.
If you are working to solve any of these problems then please consider working with us getstarted@peacockconsulting.com. We have had continued success accelerating software delivery and implementing all of these topics at scale.